Simpson’s Paradox points to a reversal of trends when a dataset is divided into subgroups or vice-versa.
It’s your brother’s birthday in a few days and it is your responsibility to choose the best restaurant for the party. After conducting thorough research, you choose a restaurant called ‘The Orchard.’ Most of the reviews on the internet show a rating of more than 4.5, meaning that almost everyone must love the restaurant.
Unfortunately, none of your friends seem excited. They decide to divide the reviews into two categories of young people and old people. Their analysis shows that more young people and more old people prefer the restaurant ‘The Bistro’, even though its rating online is only a 4.2.
Why is that so? Is the whole rating system a façade, or is this some kind of sorcery?
In reality, you’re just stuck in Simpson’s Paradox.
Recommended Video for you:
Can Statistics Be Misleading?
The importance of data analyses and statistics is increasing with every passing day. Be it weather prediction, the dropping sales of a company, or even predicting the future relations of a country with its neighbors, everything on the globe is being looked at and confirmed by examining vast datasets. This is clearly the most objective way of doing things.
The question is, is your data helping you reach perfect conclusions, or is there any implicit bias?
Unfortunately, sometimes you might derive the wrong conclusions due to Simpson’s Paradox.
According to Simpson’s Paradox, a conclusion drawn from a particular dataset can be reversed when that same dataset is further divided into subgroups.
In the aforementioned situation, when the same data was divided into two groups of young people and old people, the trend concerning the popularity of restaurants reversed.
Let’s express our example mathematically to make it clearer.
| Young People | Old People | Total | |
| Percentage of people who like The Orchard | 80/100 = 80% | 370/400 = 92.5% | 450/500 = 90% |
| Percentage of people who like The Bistro | 326/400 = 81.5% | 94/100 = 94% | 420/500 = 84% |
Table 1: The most preferred restaurant.
It can be seen that when the total reviews of The Orchard and The Bistro are compared, 90% prefer the former one, whereas only 84% prefer the latter. However, when the reviews are divided into two groups of young and old people, The Bistro comes out as the more preferred restaurant. There is no magic responsible for this paradox, but it occurs due to the change in the level of explanation. For instance, here the population has been divided into two subgroups.
Sometimes the paradox might also occur due to the ignorance of a third variable. For example, when considering the mortality rate of humans in two countries A and B, country A might seem to be better off, but what you might be ignoring is the level of health of the population.
Thus an analysis of data alone cannot provide perfect conclusions and data analysis is not immutable. Rather, statistical relationships can sometimes be misleading.
How Did Simpson’s Paradox Come Into Being?
Simpson’s Paradox is known by different names among the global community of statisticians – Simpson’s reversal, Amalgamation paradox, and the Yule-Simpson Effect.
It was Edward H. Simpson who first published a technical paper (in 1951) named “The Interpretation of Interaction in Contingency Tables” stating the paradox, but it is amusing to note that he was not the first one to observe this anomaly. Udny Yule in 1903 and Karl Pearson in 1899 also mentioned a similar concept.
However, it was Cohen and Nagel in 1934 who came up with the first practical problem, and it was Blyth in 1972 who called it a paradox.
In 1981, a paper called “The role of exchangeability in inference” was published by Lindley and Novick. They performed a deeper analysis of Simpson’s Paradox and derived the conclusion that statistics could in no way help a person computing a dataset to know whether the conclusion derived is correct or not.
Thereby, they stated that a dataset, be it aggregated or divided, should be chosen according to the context. In case both datasets are required and there is a reversal of conclusions, some external information not pertaining to statistics should be taken into consideration, such as the health of the general population when calculating the mortality rate.
The Curious Case Of UC Berkeley
When UC Berkeley’s data of admissions for the fall of 1973 was analyzed, there appeared to be a gender bias. The University was sued for favoring men over women. It was seen that out of 4,351 females who applied, only 35% were selected, whereas of the 8,442 males who applied, 44% were selected.
However, when department-wise analysis of data was performed, it was seen that many departments seemed biased towards women.
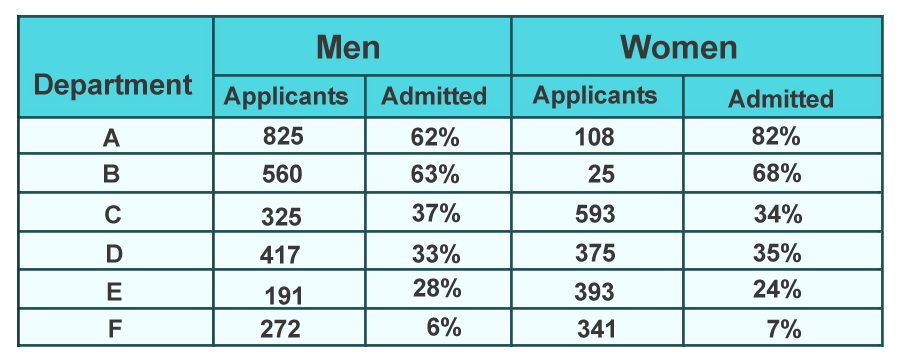
This reversal of bias appeared because women tended to apply more often to departments that were more competitive or had lower acceptance rates.
Simpson’s Paradox And The COVID-19 Crisis
Simpson’s Paradox has also established itself in COVID-19 statistics. COVID-19 case fatality rates (Case fatality rate or CFR determines the chances of survival of a patient infected with COVID-19) of China and Italy were compared.
When the total cases of China (February 2020) were compared with the total cases in Italy (March 9, 2020), it was found that the chances of survival in China were higher than those in Italy.
However, when the population was divided into different age groups and then the CFR was compared, it was found that the chances of survival of each age group were higher in Italy.
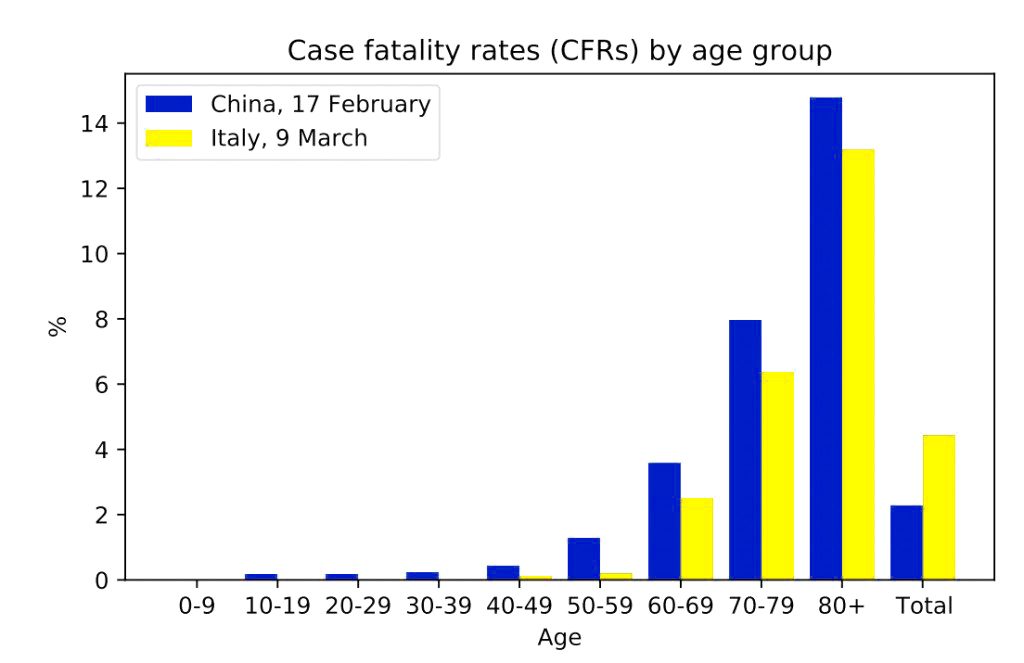
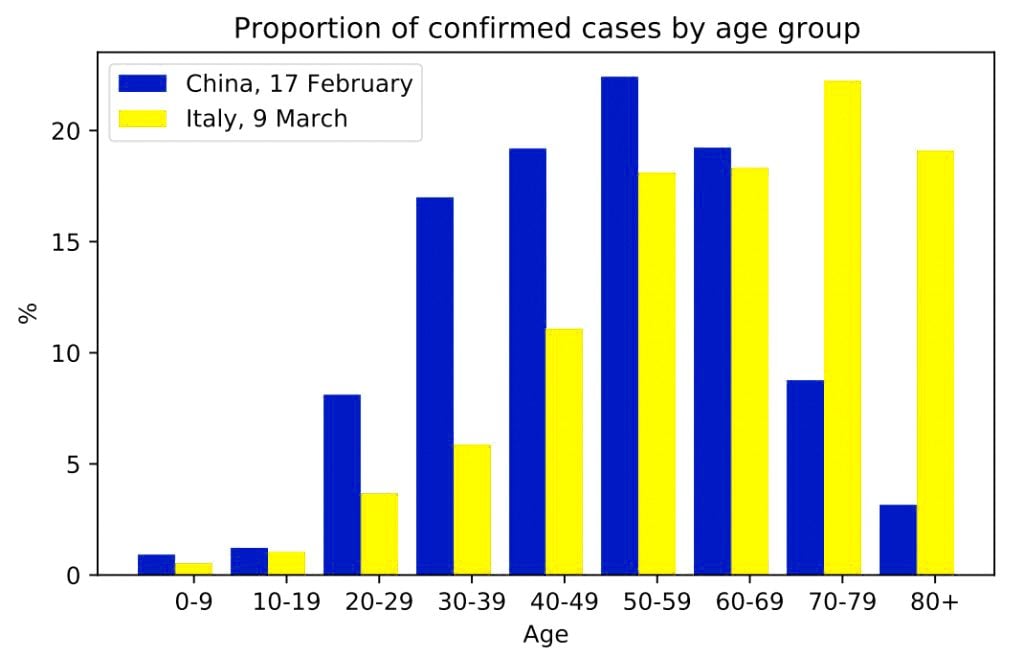
This is a clear case of Simpson’s Reversal. The paradox arose because of the difference in the age demographics of the two countries. It was noted that Italy had a higher proportion of confirmed COVID-19 cases in the older age bracket—people whose risk of dying is already higher. This point explains the mismatch between the CFRs. However, according to the researchers, some other factors, like differences in testing, might also contribute to this anomaly.
Conclusion
While this world is drowned in an ocean of statistics and data, there are certain paradoxes, like Simpson’s Paradox, which ring bells in the minds of statisticians. Simpson’s Paradox brings us back to the reality that data alone cannot be the panacea to all problems, and we cannot always make correct predictions based on data. Many times, there is a need to look beyond and bring many external parameters into view, which might often be non-palpable, like the emotions of a populace with respect to their ruling government. Thus, there can be causal interpretations of such paradoxes that are ignored while performing a purely practical and traditional statistical analysis.
References (click to expand)
- (2021) Simpson's Paradox - Stanford Encyclopedia of Philosophy. Stanford University
- (2018) Simpson's Paradox: Examples - PMC - NCBI. The National Center for Biotechnology Information
- (2013) Understanding Simpson's Paradox - UCLA Computer Science. The University of California, Los Angeles
- When average isn't good enough: Simpson's paradox in .... The Brookings Institution
- PJ Bickel. Sex Bias in Graduate Admissions: Data from Berkeley. The University of Iowa
- von Kügelgen, J., Gresele, L., & Schölkopf, B. (2020). Simpson's paradox in Covid-19 case fatality rates: a mediation analysis of age-related causal effects (Version 3). Arxiv.


